Web Dashboard
The manager includes a web dashboard for visual sandbox management. Access it via claude-remote ui (SSH tunnel) or directly if you can reach the manager’s listen address.
Features
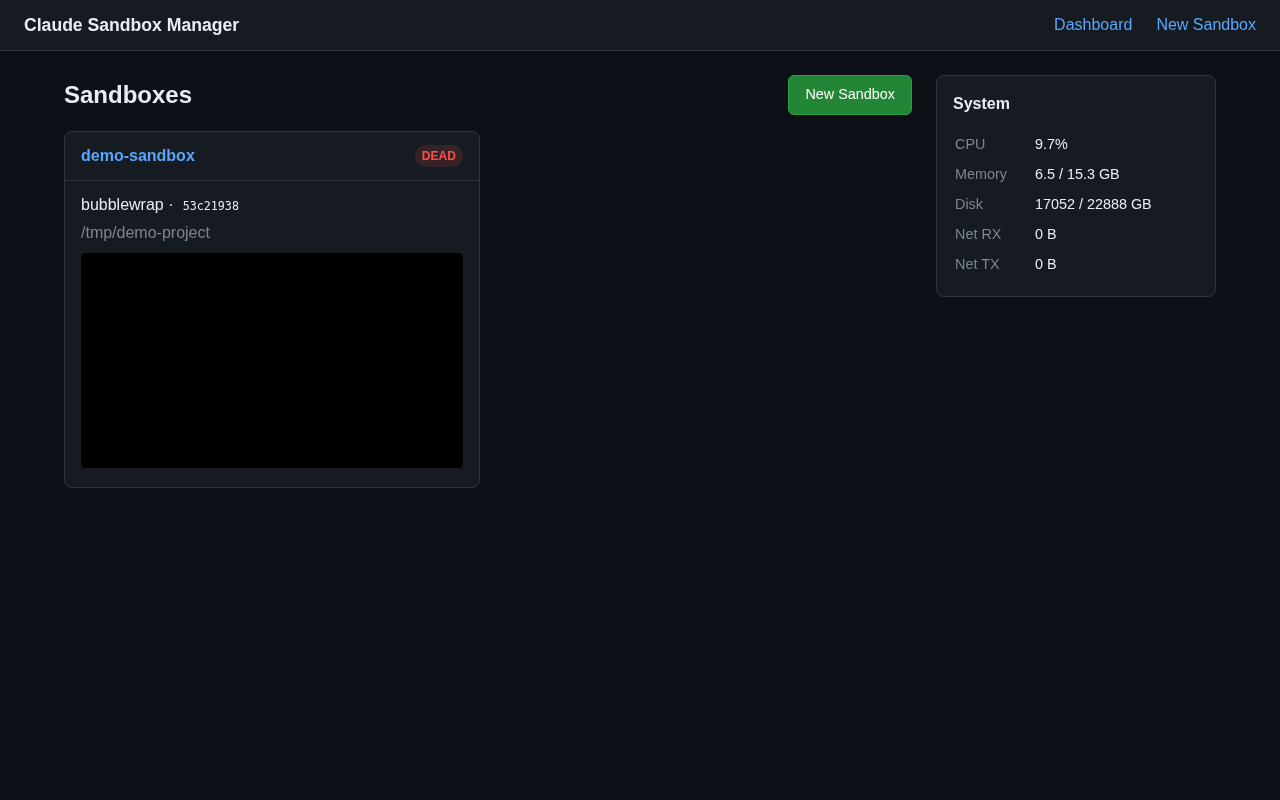
- Sandbox list — all sandboxes with status badges, backend type, and creation time
- Live screenshots — captured every 2 seconds from Xvfb or QEMU QMP
- Sandbox detail — individual page with live screenshot feed, Claude session metrics, and real-time log viewer
- Real-time log streaming — WebSocket-powered terminal view of sandbox tmux output
- Create form — HTML form for creating new sandboxes
- System metrics — CPU, memory, disk usage
Sandbox Detail
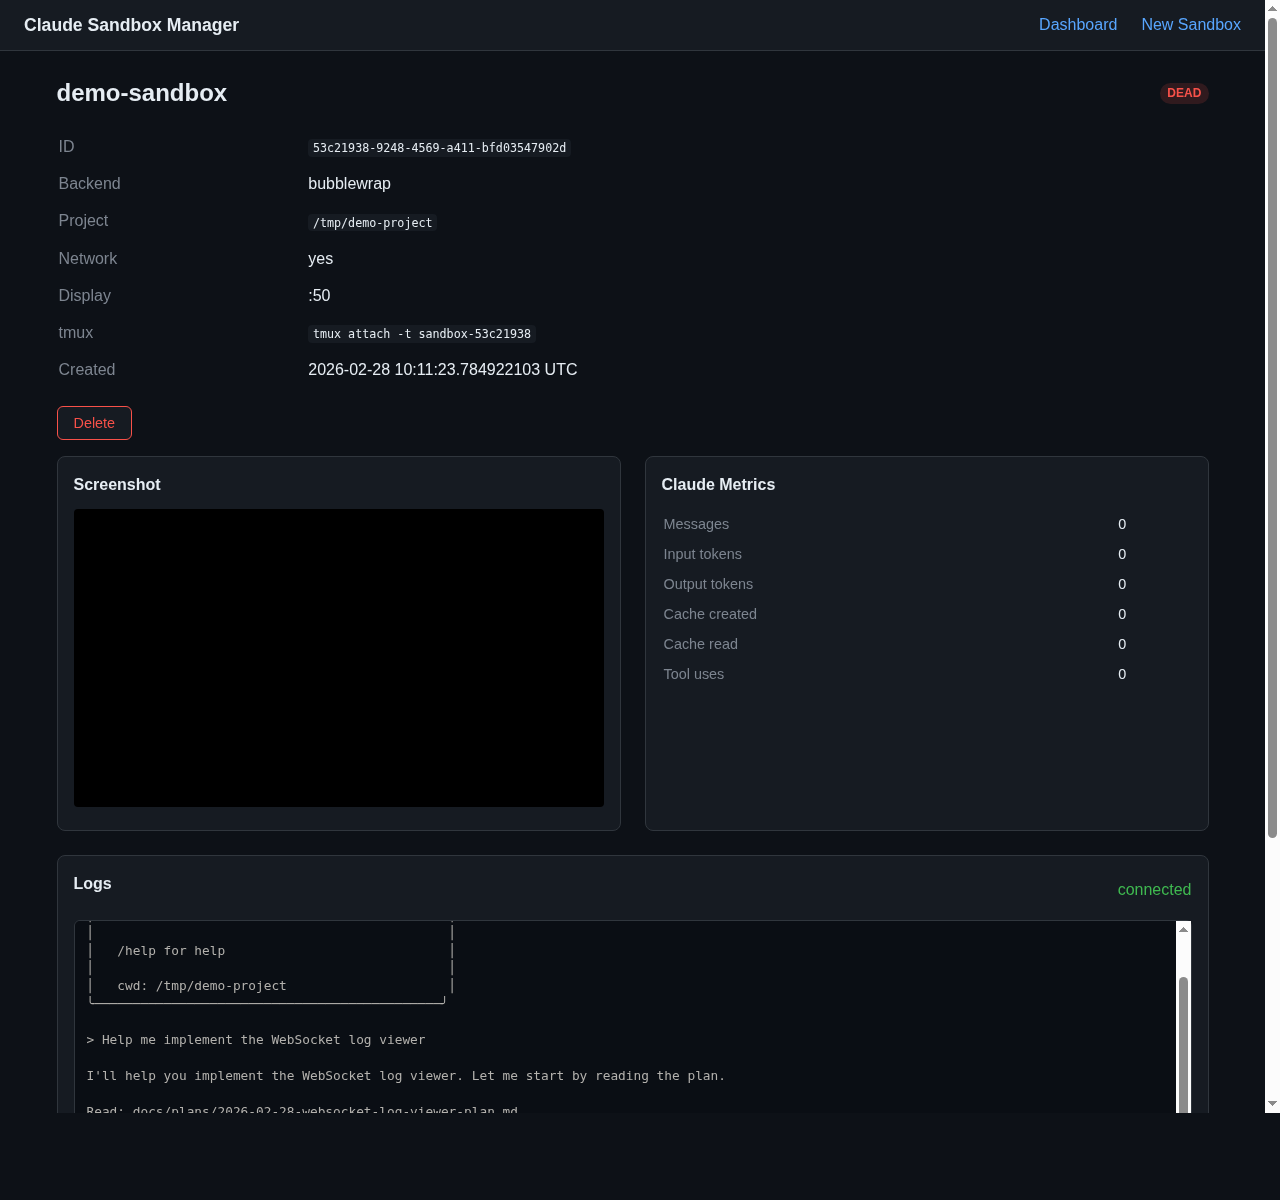
Each sandbox detail page shows:
- Sandbox info — ID, backend, project directory, network status, display number, tmux session
- Live screenshot — auto-refreshing Xvfb or QEMU screendump
- Claude metrics — messages, input/output tokens, cache stats, tool uses (parsed from Claude’s JSONL session files)
- Log viewer — real-time streaming of the sandbox’s tmux output via WebSocket, with connection status indicator and auto-scroll
Technology
The dashboard is server-rendered HTML with htmx for auto-refreshing fragments. There is no JavaScript build step — htmx and CSS are vendored as static files, and HTML templates are compiled into the binary via askama.
Log streaming uses a WebSocket endpoint (/ws/sandboxes/<id>/logs) that tails the sandbox’s tmux pipe-pane log file and pushes new lines to connected clients in real time.
htmx fragments
The dashboard uses htmx polling to keep content fresh without full page reloads:
| Fragment endpoint | Description |
|---|---|
/fragments/sandbox-list | Sandbox list on the index page |
/fragments/system-metrics | System metrics display |
/fragments/sandboxes/<id>/claude-metrics | Claude session metrics for a sandbox |
/fragments/sandboxes/<id>/screenshot | Live screenshot <img> tag |
WebSocket endpoint
| Endpoint | Description |
|---|---|
/ws/sandboxes/<id>/logs | Real-time log stream (sends last 1000 lines as backlog, then new lines as they appear) |
REST endpoint
| Endpoint | Description |
|---|---|
/api/sandboxes/<id>/logs | Full log file as text/plain |
Pages
| URL | Description |
|---|---|
/ | Index — sandbox list + system metrics |
/new | Create sandbox form |
/sandboxes/<id> | Sandbox detail — screenshot + metrics + log viewer |